Spiegelhalter’s Z-test
Theoretical background
Spiegelhalter’s Z-test is a statistical test that tests whether a probabilistic model is calibrated. It is named after the statistician David Spiegelhalter, who proposed it in 1986. It is a non-parametric test that does not require any binning.
The Spiegelhalter’s Z-test was inspired by the fact that the Brier score (mean squared error) can be decomposed into reliability and resolution. In fact, any proper scoring rule can be decomposed into reliability and resolution, as shown by Brocker (2008). For example, the cross-entropy can be decomposed into KL-divergence (reliability) and entropy (resolution).
The Brier score can be decomposed into reliability and resolution as follows:
Where the first term measure the reliability/calibration and the second term measure the resolution/discrimination.
The Variance of the Brier score is:
and the Speigelhalter’s Z-test is defined as:
and \(Z\) is approximately standard normal distributed under the null hypothesis of calibration. Spiegelhalter’s Z-test has the right size in many situations and it is powerful in many situations.
Pros of Spiegelhalter’s Z test
Spiegelhalter’s Z test is a statistical test which can provide statistical evidence that the null hypothesis (well-calibrated) is true or false. It is a non-parametric test and doesn’t require any hyperparameter tuning. It also doesn’t require any binning of data, which is extremely useful compared to the Hosmer-Lemeshow test.
Cons of Spiegelhalter’s Z test
The power of Spiegelhalter’s Z test is limited for some cases of miscalibration, such as prevalence shift. However, it is a very powerful test for many other cases of miscalibration.
Calculating the Spieegelhalter Z score and p-value using calzone
We can call functions from the calzone package to calculate the Spiegelhalter Z score and p-value directly.
[1]:
from calzone.utils import reliability_diagram,data_loader
from calzone.metrics import spiegelhalter_z_test
import numpy as np

wellcal_dataloader = data_loader(data_path="../../../example_data/simulated_welldata.csv")
z,p_value = spiegelhalter_z_test(wellcal_dataloader.labels,wellcal_dataloader.probs,class_to_calculate=1)
print(f"Z-score: {z}, p-value: {p_value}")
Z-score: 0.3763269161877356, p-value: 0.7066738713391099
We can also use the CalibrationMetrics class
[2]:
from calzone.metrics import CalibrationMetrics
calmetrics = CalibrationMetrics(class_to_calculate=1)
calmetrics.calculate_metrics(wellcal_dataloader.labels, wellcal_dataloader.probs, metrics=['SpiegelhalterZ'])
[2]:
{'SpiegelhalterZ score': 0.3763269161877356,
 'SpiegelhalterZ p-value': 0.7066738713391099}
P-value of Spiegelhalter’s z test
Like to HL test, we can check whether the Spiegelhalter’s z test has the correct size.
[3]:
### The size of HL Test
from calzone.utils import fake_binary_data_generator
np.random.seed(123)
fakedata_generator = fake_binary_data_generator(alpha_val=0.5, beta_val=0.5)
cal_metrics = CalibrationMetrics()
sample_size = 1000
simulation_size = 10000
results = []
# generate data
for i in range(simulation_size):
    X, y = fakedata_generator.generate_data(sample_size)
    if i == 0:
        tempresult = cal_metrics.calculate_metrics(y, X, ['SpiegelhalterZ'],return_numpy=False)
        keys = list(tempresult.keys())
        results.append(np.array(list(tempresult.values())))
    else:
        tempresult = cal_metrics.calculate_metrics(y, X, ['SpiegelhalterZ'],return_numpy=True)
        results.append(tempresult)
results = np.array(results)
[4]:
### Showing the size of the model
import matplotlib.pyplot as plt
z_scores = results[:,0]
p_values = results[:,1]
size = np.mean(p_values < 0.05)
print("The size of Spiegelhalter's z test is :", round(size,3))
The size of Spiegelhalter's z test is : 0.049
[5]:
value,_,_=plt.hist(p_values, bins=20, density=True, alpha=0.5, label='p-value',histtype='step')
plt.vlines(size,ymin=0,ymax=np.max(value),linestyle='--',label=r'Size($\alpha=0.05$) = '+str(round(size,3)),colors='r')
plt.legend(loc='upper right')
plt.xlabel('p-value')
plt.ylabel('Density')
plt.title("P-value distribution of the Spiegelhalter's z test")
[5]:
Text(0.5, 1.0, "P-value distribution of the Spiegelhalter's z test")
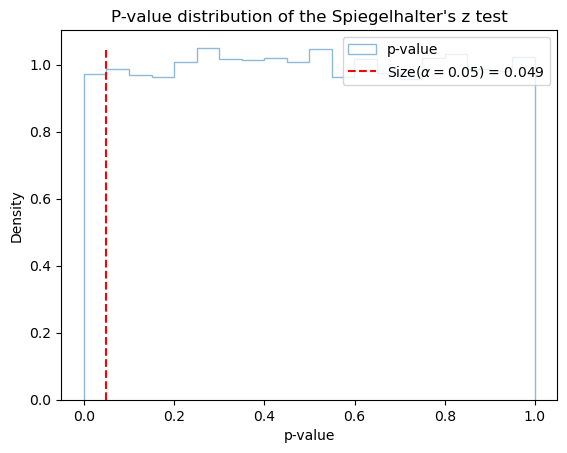
We can see that Spiegelhalter’s Z test has a accurate size.
Reference
Spiegelhalter, D. J. (1986). Probabilistic prediction in patient management and clinical trials.
Bröcker, J. (2009). Reliability, Sufficiency, and the Decomposition of Proper Scores. Quarterly Journal of the Royal Meteorological Society, 135(643), 1512–1519. https://doi.org/10.1002/qj.456